Overview
Key Concepts
General
- Index
- Favorites
- User Getting Started
- General
- User Key Concepts
- Search
- User Testing and Debugging
- User Interface
Account
- Index
- Add a Group to an Organization
- Add a New Azure Cloud
- Add a New Cloud
- Add a User To a Group
- Add a User
- Add a User to a Team
- Azure Setup
- Azure
- Catalogs
- Clouds
- Cost Management
- Create a Team in an Organization
- Delete a Platform
- Deploy an Organization
- Deployment Approval Process
- Enable Access to an Assembly for a User on a Team
- Environment Profiles
- How Cost Tracking and Reporting Works
- Import and Export Catalog
- Account
- Manage OneOps User Accounts
- Notifications
- OneOps Policy Management
- Organization Summary
- Provide Only Necessary Privileges to Accounts
- Reports Summary
- Restrict Access with Teams
- Secrets Proxy
- Security Groups
- Shutdown a Cloud
- View a Reports Summary
- View, Add, or Edit Environment Profiles
- View an Organization Summary
- View Assembly and Organization Consumption with Reports
Design
- Index
- Add a Platform to a Design
- Add a Variable
- Add ELK Stack to an Application
- Add or Delete a Security Group to Open or Close an Additional Port
- Add a Team to an Assembly
- Apache HTTP Server Component
- Apache HTTP Server Pack
- Apache Tomcat Pack
- Artifact Component
- Attachments
- Variables Override Prevention
- Certificate Component
- Chocolatey Package Component
- Components
- Compute Component
- Create Assemblies to Design Applications
- Create Environment Dependency with Environment Profiles
- Daemon Component
- Design Best Practices
- Download Component
- Edit a Platform
- Enable https for a Service (LB Certs)
- File Component
- Filebeat Component
- Firewall Component
- Fully Qualified Domain Name FQDN
- Hostname Component
- Design
- Java Component
- Job Component
- Keystore Component
- Load Balancer Component
- Library Component
- Load/Extract
- Logstash Component
- Manage Assemblies
- DotNet Framework Component
- Microsoft IIS Pack
- IIS Website Component
- Microsoft SQL Server Pack
- Naming Conventions
- NuGet Package Component
- Objectstore Component
- Operating System Component
- Packs
- Platform Links
- Platforms
- Ports by Platform
- Propagation
- Security Group Component
- Secrets Client Component
- Sensuclient Component
- Set Up Multiple Ports/Protocols in Load Balancer
- Share Component
- SSH Keys Component
- Storage Component
- Telegraf Component
- Upgrade an Application Version in an Environment
- User Component
- Variables
- View Design Releases
- Volume Component
- Watching an Assembly
- Website Component
Transition
- Index
- Add CNAME in Azure DNS
- Add CNAME
- Add or Edit Primary and Secondary Clouds
- Add or Reduce Capacity
- Availability Modes
- Configure ECV Check URL on OneOps
- Create an Environment
- Delete an Environment
- Deploy Application after Design Changes
- Deploy an Application for the First Time
- Deploy Application With Database
- Deploy an Environment
- Deploy Multiple Clouds in Parallel
- Deploy and Provision an Application and Environment for the First Time
- Edit an Environment
- Email Notification Relay
- Environment Releases
- Environment
- Transition
- Remove an Unused Cloud from an Environment
- Rollback Code
- Set Variable Cloud Scaling Percentage
- Transition Best Practices
- Transition
- View Deployment Status
Operation
- Index
- Assess the Health of Applications, Platforms and Clouds
- Auto Repair
- Auto Replace
- Auto Scale
- Computes in Operation
- Control Environment
- Enable Platform to Auto Replace Unhealthy Components
- Ensure that Alerts for Production Environment are Sent to NOC
- Find a Platform VIP Name
- Grep or Search Text in Files on Computes
- Operation
- Navigation to Monitors
- Monitors
- Operations
- Operations Summary
- Set Up a Custom Action
- Take a Node out of Traffic (ECV Disable)
- Update or Upgrade New OneOps Code
Assess the Health of Applications, Platforms and Clouds
Solution
To monitor the health of applications, platforms and clouds, follow these steps:
-
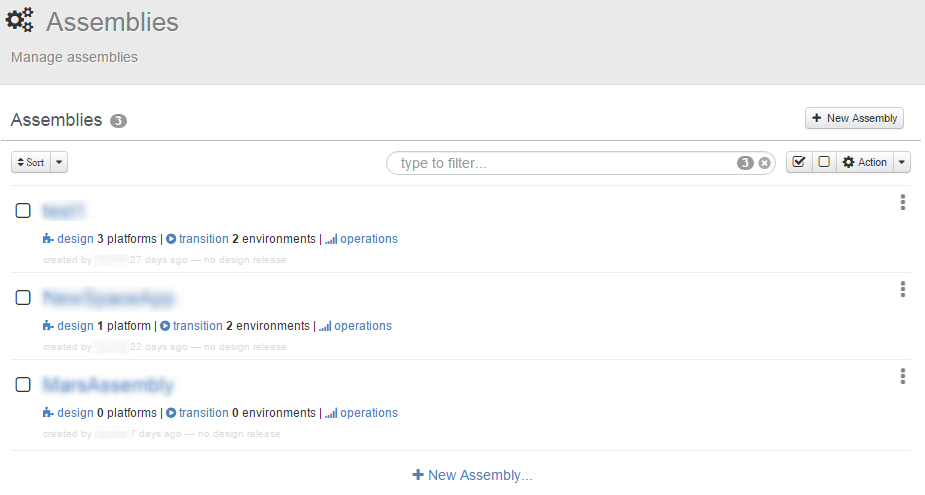
In the OneOps Dashboard, select the appropriate organization and assembly.
-
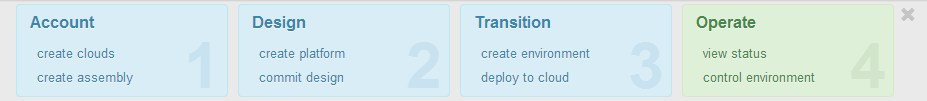
Click Operate.
The Environments page displays.
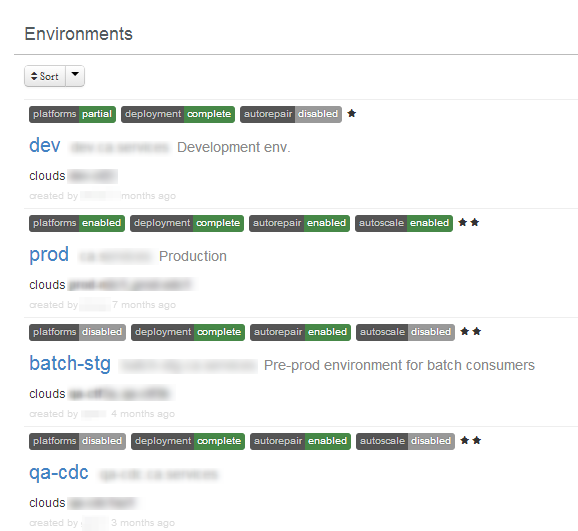
-
Select the environment.
The Environments page defaults to the summary tab that displays a status for the following conditions:
- Platforms
- Deployment
- Health
- Auto repair
The health is displayed, including the number of instances in the environment.
- Good = green
- Disabled = red

-
Click the graph tab to display an overall view of the health of the application.
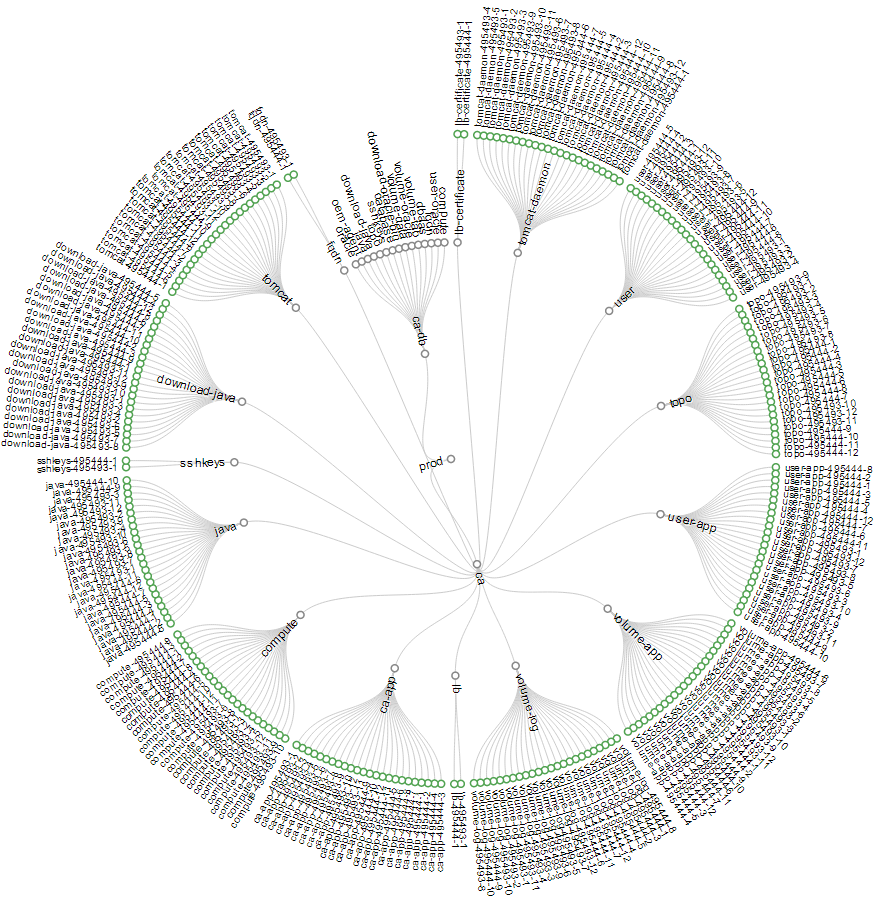
-
From the graph, view the overall health of the environment.
Each component is represented by a circle icon. The color of the icon indicates the component condition:
- Green: The environment is healthy and no action needs to be taken.
- Orange: A change is being executed. This could mean a deployment to that instance or that the instance is undergoing an auto repair.
- Red: Click on a red-colored component to investigate. Drill down to see the status of the component.
